

Your AI Visibility Dashboard Is Probably Lying to You — Silicon Valley Certification Hub Chief AI Officer Research
🏢 Meiji University & Independent Researchers
📅 September 2026
If you measure the impact of showing up in ChatGPT answers the obvious way, you will overstate the result by more than half. That is not a guess. It is a number from a new paper, and it lands on the desk of every marketing leader who has been asked to prove that generative search is paying off.
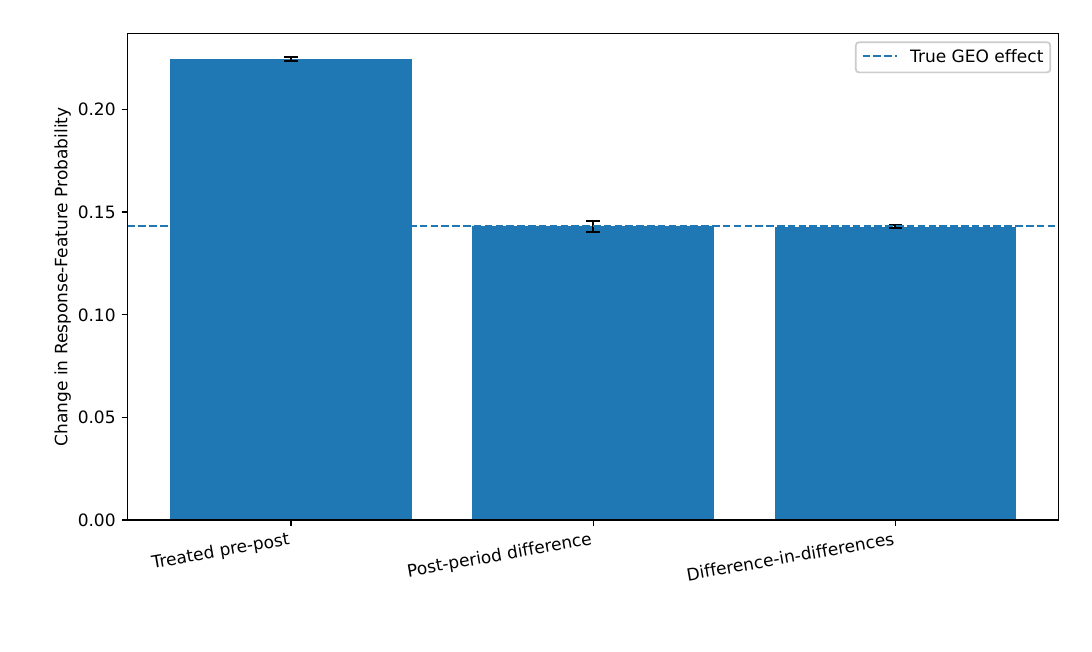
Here is the setup. Your brand starts appearing inside AI-generated answers more often. Branded search ticks up. Traffic improves. You claim the lift. Then someone asks the uncomfortable question: would that traffic have grown anyway, because everyone is using AI answers more? The paper’s answer is sharp. A naive before-and-after read put the effect at 0.225. The true effect was 0.143. Nearly 40% of the credit was a rising tide with nothing to do with your work.
The three researchers behind this, Masahiro Kato, Daiki Honma, and Taka Kato, built a causal framework for exactly this measurement problem. They call it Generative Marketing Mix Modeling, or GMMM. It is the first serious attempt to answer a question boards are now asking out loud: did our visibility inside AI answers actually drive revenue, or does it just look like it did?

Why This Paper Matters
Every marketing team is now measured on a channel that standard analytics cannot see. Generated answers produce no impression log. Nobody clicks a link when the model just says your name. So the generative channel arrives with no attribution rail, and most companies are improvising.
The improvisation takes two forms. Either you track mentions and treat them as engagement, or you run a simple before-and-after and bank the difference. Both feel reasonable. The paper shows why both can be badly wrong.
This is where a Chief AI Officer earns their seat. Whether generative visibility drives revenue is a capital allocation question now, and it needs the same rigor as any other investment claim. An AI Assessment for companies that ignores the generative layer is incomplete by definition.
Methodology, Explained Simply
GMMM splits the generative channel into two things that executives keep confusing. GEO, Generative Engine Optimization, is earning your way into an answer. You do not pay for the mention. GEM, Generative Engine Marketing, is buying a sponsored placement inside a generative engine. Different economics, different measurement, and they should not share a line item without a reason.
To measure GEO, the framework combines four inputs. Repeated generated answers show what the models actually say. Question counts show how often buyers ask the questions you care about. Share-of-use shows how the traffic splits across ChatGPT, Gemini, Claude and the rest. And notice probability captures the honest truth that a mention is not the same as a read. That last input is the one most teams skip, and it is the one that keeps your numbers from being fiction.
For GEM, the model pairs sponsored-placement records with the same notice probabilities. Then it does something clever. Instead of asking “what happened after we spent the money,” it compares expected business outcomes under alternative sequences of action. What happens if you run GEO for two quarters and then add GEM? What happens in the reverse order? The difference is the causal effect, and the paper sets out the conditions under which you can actually identify it.
That word, identify, is doing real work. It means the math only gives you a trustworthy answer if the measurement design meets a standard. No control group, no clean answer.
Results and Practical Insights
The first chart compares three ways of measuring the same GEO campaign against the true effect. Treated pre-post, the naive method, reports 0.225. The true effect is 0.143. Difference-in-differences, which subtracts the growth your untreated competitors also enjoyed, lands exactly on 0.143. The naive number is not a rounding error. It would have you defending a budget on evidence that does not survive a skeptical CFO.
The second chart answers a different question, and it is the one that decides how you spend. When GEO exposure is measured without controlling for branded search, the total effect comes out at 1.58. Control for branded search, and the direct effect is 0.70. More than half of the apparent benefit is a relabeling of demand that would of arrived through your brand anyway. If you report the 1.58 to the board and your CFO separately reports a branded-search lift, you have double counted the same dollar twice.
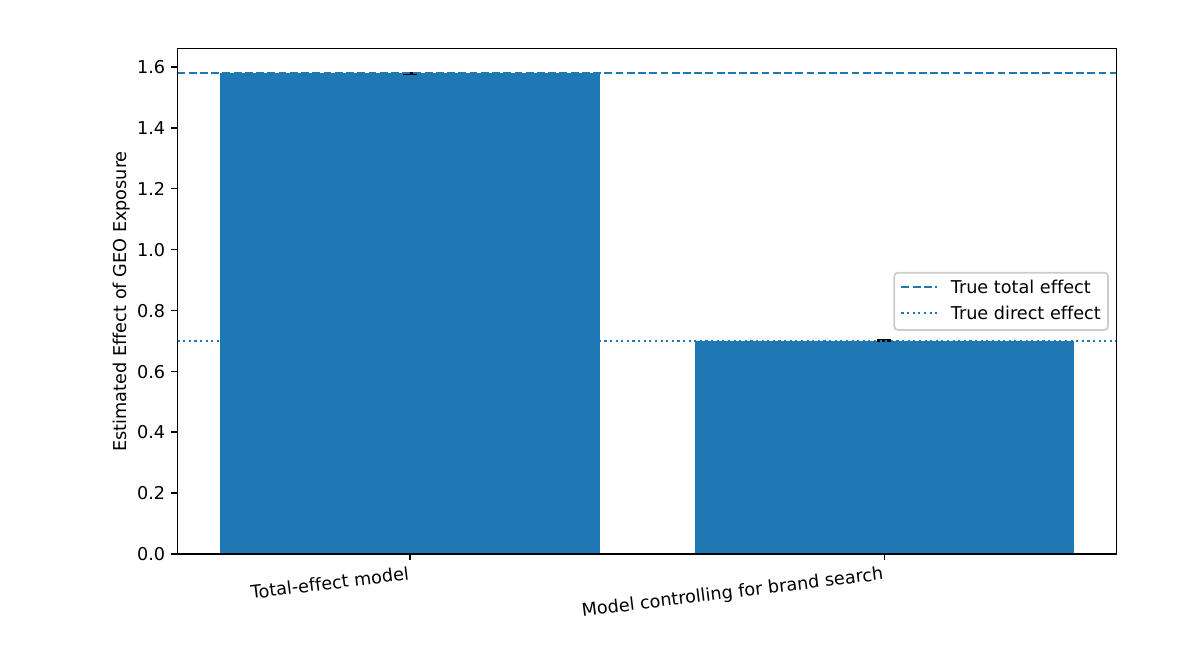
I didn’t expect the split to matter this much. Turns out, the design you pick determines which number you get, and both are defensible. The paper’s real contribution is making you declare which one you’re reporting before anyone asks.
Can you tell your board how much of your AI-answer visibility lift was real, and how much was the market growing around you?
At Silicon Valley Certification Hub, we help marketing and revenue leaders evaluate and deploy AI that fits their actual business processes, including how to govern the measurement behind it.
Key Takeaways for Marketing and Revenue Leaders
Thanks to All Authors
Want to know how this applies to your company?
At Silicon Valley Certification Hub, we help you align AI + Strategy. Our team works directly with your directors and teams to assess AI readiness, identify gaps, and build a clear path forward — tailored to your business context.
Book a time with our CEO, Alejandro Cuauhtemoc-Mejia:
https://calendar.app.google/2ihQf2JH3D9uJBe68
Silicon Valley Certification Hub — 3000 El Camino Real, Building 4, Palo Alto, CA


0 Comments